-
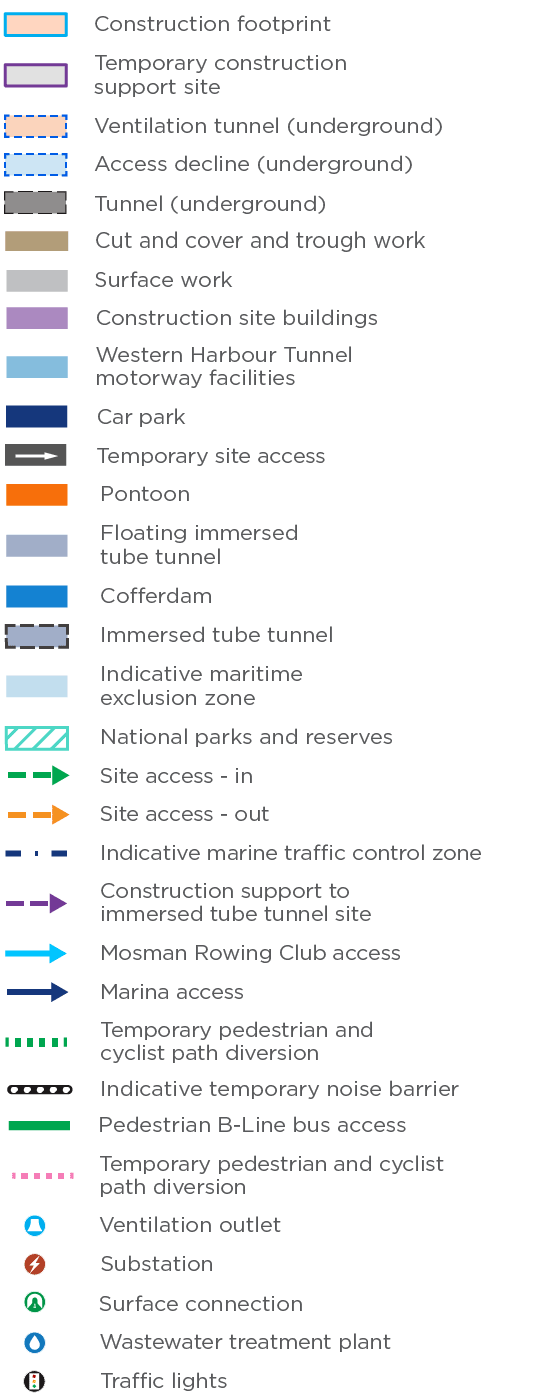
Beaches Link - tunnel
-
Beaches Link - surface
-
Beaches Link - pedestrian / active transport links
-
Western Harbour Tunnel - tunnel
-
Western Harbour Tunnel - surface
-
Warringah Freeway Upgrade
-
Improvements delivered by Beaches Link
(compared to without Beach Link by 2037) 
- Air quality
-
Reduction of 1 - 2 micrograms per cubic metre
-
Reduction of 0.8 - 1 micrograms per cubic metre
-
Increase of 0.2 - 0.8 micrograms per cubic metre
-
Increase of 0.8 - 1.8 micrograms per cubic metre
- Noise walls
-
Existing noise walls
-
Temporary noise walls
-
Proposed new noise walls – delivered as part of Warringah Freeway Upgrade
-
Proposed new noise walls
- Noise and vibration
-
>= 75 dBA
-
70 dBA
-
65 dBA
-
60 dBA
-
55 dBA
-
50 dBA
-
45 dBA
-
40 dBA
-
<= 35 dBA
Map layers – Surburbs
Map layers – Construction
Click a checkbox to show or hide the layer
Map layers – Air quality (PM2.5) change
Note: Data shows the change in annual average PM2.5 for the 2027 and 2037 cumulative scenarios, including air quality data from Western Harbour Tunnel.
Map layers – Noise walls
Map layers – Airborne construction noise
Our noise modelling shows how the level of noise from our work varies with distance from the working location. How noticeable the noise will be will depend on existing noise levels.
Our noise assessments are conservative and always assess the worst case scenario. We often find when we are working, the noise generated is less than we predicted.


